How Open Data and Open Tools Can Save Lives During a Disaster
Learn how the Resiliency Maps project helps people navigate and build resilient communities.
 Nicole MartinelliIf you've lived through a major, natural disaster, you know that during the first few days you'll probably have to rely on a mental map, instead of using a smartphone as an extension of your brain. Where's the closest hospital with disaster care? What about shelters? Gas stations? And how many soft story buildings-with their propensity to collapse-will you have to zig-zag around to get there?
Trying to answer these questions after moving back to earthquake-prone San Francisco is why I started the Resiliency Maps project. The idea is to store information about assets, resources, and hazards in a given geographical area in a map that you can download and print out. The project contributes to and is powered by OpenStreetMap (OSM), and the project's entire toolkit is open source, ensuring that the maps will be available to anyone who wants to use them.
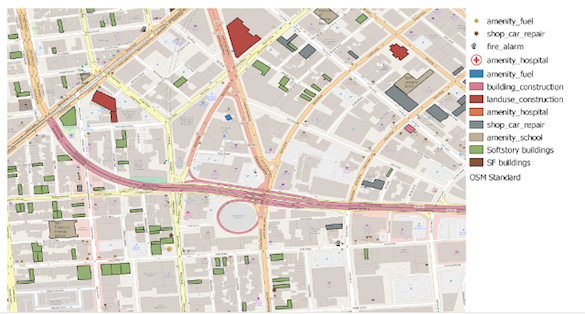
A Resiliency Map looks like a standard map with streets, buildings, etc. But the map highlights emergency-related information, including fire hydrants, shelters, construction sites, car repair shops, and similar points of interest that influence how you navigate an area after disaster strikes. These maps can also be used to track damage after an event.
 Disaster readiness map
Getting disaster-ready
The concept of resilience has never been more important or more urgent. According to the United Nations Development Program, "Over the past decade, more than 1.5 billion people have been affected by disasters that have cost at least US$1.3 trillion. Climate change, weak governance, and an increasing concentration of people and assets in areas exposed to natural hazards are driving disaster risk upwards." In many US cities, first responders are priced out of living where they work, making it essential to be able to take care of yourself and your family in the first 72 hours after any major emergency.
Like many people, you probably already have an emergency kit. (If not, get started now!) Maybe, like me, you've taken a Community Emergency Response Training (CERT) course. In addition to learning fire safety and triage, these courses teach you to look at your surroundings differently, from identifying unreinforced masonry buildings to spotting which hydrants carry potable water.
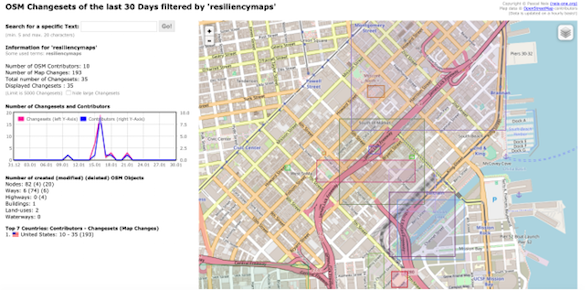
 Map edited with Field Papers process
Standard advice in disaster readiness programs is to carry a map as part of your 72-hour emergency kit. The trouble is, maps with the type of information you need in a disaster aren't readily available. (Despite going through CERT training, the map in my go bag was a tourist-board version that wasn't even to scale.) The good news is, thanks to the crowdsourced nature of OSM and the massive push for open data, making a disaster-preparation map isn't impossible. In my hometown, sources like DataSF and the Department of Building Inspection offer crucial local information, and on Data.gov you'll find datasets ranging from fire hydrants in Chapel Hill, N.C., to the National Flood Hazard Layer available in multiple formats.
Mapping it out
Resiliency Maps is just getting started, but we have already plotted a few milestones for data collection. Our first mapathon was a two-hour session using Field Papers, an open source project that gets a large group mapping without requiring people to bring laptops or have any OSM knowledge. You choose an area to map, print it out, walk outside with the paper copy, mark things up, then scan or take a photo with a QR code, and it's added as a layer to OSM. At our event, teams of three or four emergency response volunteers made a mad dash around San Francisco's SOMA neighborhood on a Saturday morning, updating construction sites, adding hydrants and fire call boxes, jotting down hazard diamonds, and the like.
 Another mapathon was completely digital: MaptimeSF, a global meetup group focused on "making maps, talking about maps, and geeking out on all things techy and spatial," hosted Resiliency Maps. This time we used Mapillary, a startup that provides ground-level imagery integrated into OSM. Participants used the images to verify and add points on the map, making about 230 changes in under two hours. At 4 am the next day, a 3.4 magnitude quake centered in Oakland shook the Bay Area awake, providing a reminder about why making these maps matters!
Get involved
The ideal Resiliency Maps contributor is interested in resilience prep and sees the need for maps. That's it. There are a ton of tools and ways that people can contribute-from using pen, paper, and shoe leather to helping with data visualization and code. In addition to collecting more data, we're working on visualization and printing and would love to hear about lightweight options that don't require expensive servers.
Resiliency Maps' goal is to build a replicable process that anyone can use to build their own maps, so please get in touch if you're interested in participating in the project or designing a map for your community.
About the Author
Nicole Martinelli is a journalist and editor at home in the busy intersection of tech and everyday life, with a special interest in data and maps. An open-source proponent since more or less forever, I've been known to hand out recipes based on the four freedoms and worn a plushy penguin costume on a few occasions. I’m currently the editor for Superuser, a publication dedicated to open infrastructure.
| How Open Data and Open Tools Can Save Lives During a Disaster was authored by Nicole Martinelli and published in Opensource.com. It is republished by Open Health News under the terms of the Creative Commons Attribution-ShareAlike 4.0 International License (CC BY-SA 4.0). The original copy of the article can be found here. |
- Tags:
- CERT training
- Community Emergency Response Training (CERT)
- data visualization
- data.gov
- DataSF
- Department of Building Inspection
- disaster care
- Disaster Preparedness
- disaster readiness map
- disaster-preparation map
- Field Papers
- Mapillary
- MaptimeSF
- National Flood Hazard Layer
- natural disaster
- natural hazards
- Nicole Martinelli
- Open Data
- open source
- open source project
- OpenStreetMap (OSM)
- resilience preparedness
- Resiliency Maps
- Resiliency Maps project
- resilient communities
- United Nations Development Program (UNDP)
- Login to post comments