Machine Learning in Healthcare: Part 2 - Tools Available to the Average Healthcare Worker
 Bob HoytThis is the second article in a series of articles on the use of machine learning in healthcare by Bob Hoyt MD FACP. Parts 1 and 3 can be read here and here.
A variety of machine learning tools are now available that can be part of the armamentarium of many industries, to include healthcare. Users can choose from commercial expensive applications such as Microsoft Azure Machine Learning Studio, SAS Artificial Intelligence Solutions or IBM SPSS Modeler. Academic medical centers and universities commonly have licenses for commercial statistical/machine learning packages so this may be their best choice. The purpose of this article is to discuss several free open source programs that should be of interest to anyone trying to learn more about machine learning, without the need to know a programming language or higher math.
Machine learning (ML) is classified into supervised and unsupervised learning.
Supervised learning indicates that you know the desired outcome of interest. Supervised learning is further broken down into classification and regression. Classification is used for predictions when the outcome (class) is categorical or nominal data, such as the patient lived or died or heart disease or no heart disease (binary or two choices). Regression is used for scenarios where the outcome (or dependent variable) is continuous (numerical) data, such as healthcare cost in dollars.
Unsupervised learning means you don't know the outcome of analysis beforehand and it is further broken down into cluster analysis and association rules. Cluster analysis looks for hidden patterns in data and has been extensively used in genomics to uncover genotypic and phenotypic patterns. For example, in one study a cluster analysis was applied to a dataset of 161 children with severe asthma and four separate new phenotypes were identified. Association rules look for associations between variables and the best example is market basket analysis, where shoppers who buy e.g. beer are more likely to buy chips. A study looked for possible associations in a large drug dataset. They found as an example, if a patient was prescribed calcium, they also received vitamin D using the association rule algorithm "Apriori."
It is worth noting that several algorithms, such as decision trees, SVM and neural networks can be used for both classification and regression. Algorithms can be fine-tuned, and all have strengths and weaknesses. For example, random forests are useful when dealing with missing data or building a non-linear model. All machine learning programs offer algorithms for supervised and unsupervised learning, but some also offer text and image mining.
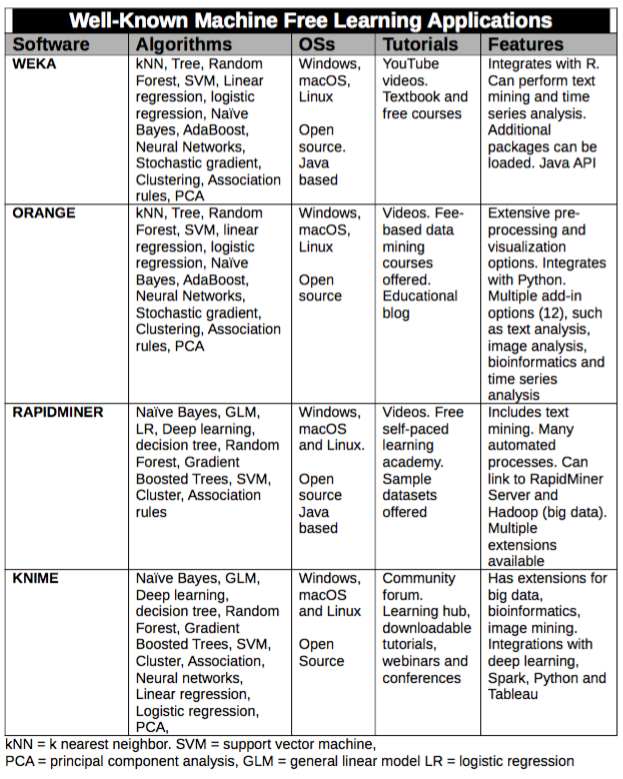
The following is a list of several well-known free ML choices: WEKA, Orange, RapidMiner, and KNIME. The first ML platform WEKA requires no programming or math skills and the graphical user interface (GUI) is intuitive, in terms of uploading data and navigating the software. The rest of the platforms require dragging a widget (Orange) or operator (RapidMiner) or node (KNIME) onto a field/window and connecting the icons together, in order to perform a function or process. Each program presented will have a screenshot to make this clearer. This is referred to as "visual programming" but it is not all like learning to write scripts or code in R or Python. There is a learning curve, but it is relatively short.
While visual programming is appropriate for visual learners, it does require learning the proper steps and sequences in order to get results. Unfortunately, the visual programming process is similar, but not identical for the three programs. These types of programs offer a good introduction to machine learning, but they are infrequently cited as the analytical method used in published studies.
Adopting one or more of these programs will provide an excellent introduction to machine learning but will not make the user an expert. Ideally, users should have some familiarity with biostatistics as a prerequisite and continued reading is important to become more knowledgeable. A variety of low cost online courses are available to supplement knowledge in machine learning. For example, ML learners should understand concepts such as bias, variance, and underfitting/overfitting.
WEKA
The exception to this list of visual operator-based machine learning applications is WEKA that was developed at the University of Waikato in New Zealand. The most recent version is 3.8.3. Not only is the software widely used, but it is also complemented by a textbook, an online course, and extensive YouTube instructional videos.
The input must be either a .csv file or an .arff file (attribute-relation file format), which is a text file that includes metadata. Data can also be uploaded from a URL or a remote database.
WEKA comes with multiple sample datasets, so the user can train on validated data. When the program is opened the choices are Explorer (default program), Experimenter (where you can compare model results with t-tests), KnowledgeFlow (Visual workflow), Workbench (combines all of the GUIs into one interface) and SimpleCLI (command line interface).
The Explorer option is divided into 5 tabs:
- Preprocess (upload, visualize, filter, clean, etc.),
- Classify (classification and regression algorithms),
- Cluster (unsupervised), Associate (unsupervised),
- Select Attributes (ranks importance of variables) and
- Visualize (creates a master scatterplot so you can see if one variable seems to correlate with another.
Pros: Program has been frequently cited in the literature. Uploading data and creating an analysis is intuitive. WEKA has a Java API. There is a library of WEKA packages that extend the functionality.
Cons: Applying filters is not intuitive and visualization options are quite limited. There is no way to simultaneously run multiple algorithms at the same time. Compared to the other programs the GUI appears outdated. Help is not embedded.
 WEKA screenshot showing results of classification with logistic regression, odds ratios and the confusion matrix generated
ORANGE
Orange is an open source platform developed by the Faculty of Computer and Information and Science Departments at the University of Ljubljana, Slovenia. The code is available on GitHub. The most recent version 3.21 is in English, client based and only offered as a free program.
Orange is easy to learn using drag and drop widgets to create workflows and is aided by multiple YouTube video tutorials (20) and examples. There are over 100 widgets organized into a left menu: Data, Visualize, Classify, Regression, Evaluate and Unsupervised. The program will accept .csv as well as .tab files and the package comes with 71 samples (.tab) files for exploration and education. Orange 3 can read Google Sheets via a URL and can upload SQL tables from a remote server. The help tab includes common workflows with an explanation.
Pros: Well organized and intuitive. Covers almost all supervised and unsupervised learning to include text and image mining. It also serves as a Python library so scripts can be run. The menu on the left is well organized and intuitive. The ability to access "add-ons" and to run Python scripts is also a plus.
Cons: No integration with R language and inability to tweak all algorithms. Also, no user forum or support for problem-solving.
 Orange screenshot showing the left menu and four classifiers generating scores, ROC curves and scatterplot.
RAPIDMINER STUDIO
RapidMiner is offered as a fee-based application, a free version with a limit of 10,000 rows and a full program free for educators and students. The most recent version is 9.2 and is a US based company.
When starting the program, a user is offered twelve templates, for example, for "market basket analysis." Multiple videos (22) are organized into getting started, preparing data, building a model, collaborating and using Hadoop (big data software). The user begins with the Design tab which involves visual programming to create the appropriate workflow by dragging operators onto a screen to create a process. After hitting the Run button, the raw data is seen in the Results tab.
In this program, initial data processing begins with visual programming. Filters and sorting can be done by dragging the correct operators into the process. Step-by-step tutorials are embedded in this process. In the Results section, there are 32 data visualization choices. The TurboPrep tab option offers data transformation, merging, and cleaning, as well as generate (the ability to add new columns and formulas) and create pivot tables. The AutoModel tab option is a step-by-step process to build a model broken down into "Predict" (classification and regression), "Cluster" and "Outliers." Using the predict option, it runs nine common classification algorithms at the same time, as well as runtimes and generates ROC curves for each for comparison. Each algorithm run (example - logistic regression) has the following sections: Model (graphical representation), Simulator (sliders change inputs which changes the output), Performance (accuracy, classification errors, ROC curve, precision, recall, f measure, sensitivity and specificity), Lift Chart (similar to ROC curve), Optimal parameters (model performance for different feature sets), Predictions (provides prediction for each row).
RapidMiner has been cited by Garter six years in a row in the "magic quadrant" for data science and machine learning.
Pros: Good choice for a novice, as well as experienced data scientists. Collaboration can be extended by RapidMiner server and RapidMiner Cloud. All algorithms were run at the same time and useful performance measures are automatically generated. The program automatically generates a correlation matrix that shows correlations between columns. This is a very comprehensive ML program. There are 153 algorithms listed under modeling, with the ability to search for them by name. Using extensions will add text mining, web crawling, and integration with R and WEKA. Python scripting is also available. RapidMiner is a hybrid in the sense that it includes visual programming plus an automatic model builder that does not require the use of visual operators. Help is embedded.
Cons: None found other than the learning curve to use the correct operators in the correct sequence.
 RapidMiner screenshot showing the Naïve Bayes simulator
KNIME (Konstanz Information Miner)
KNIME (pronounced naim) Analytics Platform is an open source multi-language international solution based in Zurich, Switzerland. Like RapidMiner it has been in Gartner's Magic Quadrant for the last six years. The most recent version is 3.7 and is available free or fee-based. The fee-based version (KNIME server) allows for collaboration with multiple users. The platform integrates with Google Drive and Tableau's Hyper format. Data samples are available for download from the KNIME server for use on the local computer. KNIME Workbench includes a Node repository with an extensive list of algorithms and a description. It also includes Workflow Coach that makes recommendations as to which nodes might be used with your data.
Pros: No limitations to the free version. Using "extensions" means access to more algorithms, more database integrations, big data integrations, text and image mining. Integrates with external programs such as R, Python, and WEKA. Supports multiple data types, such as XML and JSON. There are an active user forum, a blog, a KNIME certification program and international conferences.
Cons: Very small font for most screens. Less intuitive than RapidMiner or Orange.
 KNIME screenshot of workflow from data to ROC curve and Scorer
Summary.
In summary, four open source machine learning applications have been presented that have a manageable learning curve and are affordable. None require programming knowledge or higher math. Orange and KNIME are strictly visual programming platforms, whereas RapidMiner is a hybrid and WEKA is strictly a graphical user interface (GUI) platform. All of the platforms offer a myriad of algorithms for supervised and unsupervised learning as well as other features such as text and image mining.
In my opinion, RapidMiner is the most modern platform, aided by the options to run TurboPrep for data preparation and AutoModel for predictive analytics. WEKA is one of the easiest to use, but the GUI is antiquated in appearance and lacks comprehensive visualization options. For the novice who would like to learn visual programming Orange is perhaps the most straightforward choice.
The starting point for most beginners would be to upload several of the validated small "sample" files that accompany each platform and get comfortable with data exploration and descriptive statistics that each platform generates. Next, there should be an effort to run classification and regression algorithms. Users should analyze the performance of each algorithm and experiment with several models. Lastly, with more experience, datasets can be analyzed using clustering and association rules.
In Part three of this series, we will provide examples of how machine learning applications can provide a user-friendly approach to model building and predictive analytics with multiple algorithms.
- Tags:
- Artificial Intelligence Solutions
- biostatistics
- Bob Hoyt
- Hadoop
- healthcare
- IBM SPSS Modeler
- KNIME
- machine learning (ML)
- machine learning tools
- Microsoft Azure Machine Learning Studio
- Open Source Platform
- open source programs
- Orange
- predictive analytics
- R Language
- RapidMiner
- University of Ljubljana
- University of Waikato
- Weka
- Login to post comments